


Choose an AI assistant to open this article URL with a summary request. Review generated summaries against the original article.
| QUICK ANSWER: To track email marketing performance, define one business goal, tag every link, connect campaign data with website or CRM outcomes, and review delivery, clicks, conversions, revenue, unsubscribes, and complaints together. Compare results by audience segment and campaign type, then run controlled tests that change one meaningful variable at a time. |
Start With the Business Outcome
The best answer to how to track email marketing performance begins before a campaign is sent. Decide what the email is supposed to achieve. A welcome email might aim for account activation, a newsletter for qualified website visits, a product announcement for trials, and a retention message for repeat purchases. If the goal is vague, the report will fill with numbers that look interesting but do not guide a decision.
Choose one primary outcome and a small set of supporting indicators. For example, an e-commerce campaign may use revenue per delivered email as the primary metric, with click rate, conversion rate, unsubscribe rate, and spam complaints as diagnostics. A B2B nurture email may prioritize demo requests or qualified replies. This hierarchy prevents a high open rate from being called a success when the campaign produced no useful action.
| MEASUREMENT PRINCIPLE: A useful metric changes what you do next. If a number cannot influence targeting, content, timing, budget, or follow-up, it is probably a vanity metric. |
Build the Measurement Foundation
Use consistent campaign naming
Create a naming convention that identifies the date, audience, lifecycle stage, offer, and version. A label such as 2026-08-trial-users-onboarding-a is far easier to analyze than Newsletter Final 2. Use the same naming pattern in your email platform, analytics tool, CRM, and reporting sheet so records can be matched without manual guesswork.
Tag every important link
Add campaign parameters to destination URLs so your web analytics platform can attribute sessions and conversions. At minimum, use a source, medium, and campaign value. Add content or creative identifiers when multiple calls to action point to the same page. Keep values lowercase and standardized. Test every URL before sending, including links in buttons, images, text, logos, and footers.
Connect email identity to downstream outcomes
Email-platform reports show delivery and interaction events; they do not automatically show whether a lead became a customer or whether a customer retained. Connect campaign IDs to website analytics, CRM stages, order data, or product events. Use privacy-respecting identifiers and access controls. The goal is not to collect everything, but to connect campaign exposure with the outcome you defined.
Core Email Marketing Metrics and Formulas
Delivery rate and bounce rate
Delivery rate is delivered messages divided by messages sent, multiplied by 100. Bounce rate is bounced messages divided by messages sent, multiplied by 100. Separate hard bounces, which indicate permanent failures such as invalid addresses, from soft bounces, which can reflect temporary mailbox or server problems. Remove or suppress hard bounces quickly and investigate sudden changes in delivery by domain or segment.
Open rate
Open rate is unique tracked opens divided by delivered messages, multiplied by 100. It can help compare subject lines, sender recognition, and send timing within a consistent setup. However, it is no longer a clean measure of human reading. Image blocking can hide real opens, while privacy proxies and automated image loading can create opens that did not come from deliberate attention.
Apple states that Mail Privacy Protection hides IP addresses and prevents senders from reliably seeing whether a recipient opened an email. Mailchimp also recommends excluding Apple privacy and bot activity when possible. Use open rate directionally, segment privacy-affected traffic if your platform supports it, and give more weight to clicks, replies, conversions, and revenue.
Click rate and click-to-open rate
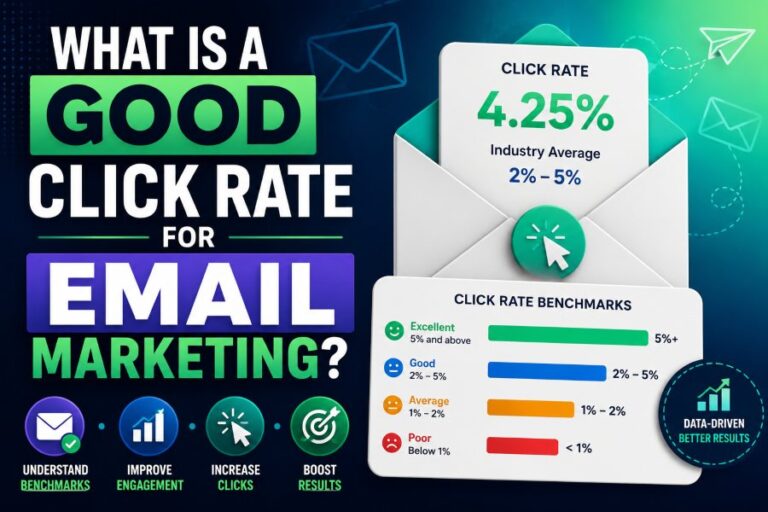
Click rate is unique recipients who clicked at least one tracked link divided by delivered messages, multiplied by 100. It measures the combined effect of audience, deliverability, message relevance, design, and call to action. Click-to-open rate, often called CTOR, divides unique clickers by unique tracked openers. CTOR can help assess content after an open, but its denominator inherits the limitations of open tracking.
Conversion rate
Conversion rate needs an explicit denominator. Campaign conversion rate commonly means conversions divided by delivered emails; post-click conversion rate means conversions divided by unique clickers. State which one you use. The first evaluates the entire email funnel, while the second focuses on the landing page and offer after the click.
Revenue, ROI, and revenue per delivered email
Track total attributed revenue, average order value, and revenue per delivered email. The last metric is useful because it normalizes performance across campaigns of different sizes. A practical email ROI formula is attributable gross profit minus campaign cost, divided by campaign cost, multiplied by 100. Define attribution windows and whether you count click-through, view-through, assisted, or last-touch revenue before comparing reports.
Unsubscribes, complaints, and list health
Unsubscribe rate and spam complaint rate are guardrails, not inconveniences to hide. Review them by acquisition source, segment, message type, and frequency. Also track engaged-list growth: new subscribers who remain reachable and active after subtracting unsubscribes, hard bounces, and suppressions. A growing list with falling engagement can be less valuable than a smaller list of people who consistently act.
Use a Simple Campaign Scorecard
- Primary outcome: revenue, qualified leads, activations, registrations, renewals, or another business result.
- Reach: sent, delivered, bounced, and inbox-placement diagnostics where available.
- Engagement: unique clicks, click rate, replies, and meaningful on-site actions.
- Conversion: conversion count, campaign conversion rate, and post-click conversion rate.
- Value: revenue, profit, pipeline value, revenue per delivered email, or cost per outcome.
- Audience health: unsubscribes, complaints, inactive subscribers, and engaged-list growth.
Report the current value, a comparable baseline, the absolute change, and the relative change. Compare like with like: promotional campaigns with promotions, onboarding messages with onboarding messages, and similar audience segments over similar time windows. A weekly newsletter should not be judged against a password reset message.
Track Performance Across the Full Funnel
Email reports can look strong while the customer experience fails after the click. Break the journey into delivery, attention, action, landing-page behavior, conversion, and retention. If delivery falls, inspect authentication, reputation, list quality, and volume. If clicks fall while delivery is stable, investigate targeting, promise, content, and CTA. If clicks are healthy but conversions fall, focus on message-to-page alignment, page speed, form friction, price, trust, or offer quality.
Google’s sender guidance recommends consistent sending, gradual volume increases, low spam rates, authentication, and regular monitoring of server responses and domain reputation. These operational signals belong in performance reviews because a creative test cannot succeed if messages do not reach the intended inboxes.
Segment the Report Before Drawing Conclusions
A blended average can hide the story. Break results down by new versus returning subscribers, customer status, acquisition source, geography, device, domain, lifecycle stage, product interest, and recent engagement where appropriate. Use segments that have a clear business meaning and enough volume to avoid overreacting to random variation.
For example, a campaign’s overall click rate may be flat while clicks rise sharply among active customers and fall among older leads. The correct action may be to build a re-engagement path for inactive subscribers rather than rewrite the email for everyone. Segmentation turns one average into a specific decision.
Run Tests That Produce Reliable Learning
- Write a hypothesis that connects one change to one expected outcome.
- Choose a primary metric and guardrails before the test begins.
- Randomly split a sufficiently large, comparable audience.
- Change one major variable, such as the offer, CTA, subject line, or content angle.
- Run both versions under the same timing and delivery conditions.
- Record the result, confidence, limitations, and next test in a shared learning log.
Do not select a winner from a tiny early sample simply because one percentage is higher. Wait for the planned window, account for delayed conversions, and repeat important findings. Subject-line tests optimize the decision to open; offer and CTA tests are usually closer to the business outcome.
Audit Data Quality Before Trusting the Dashboard
A polished report can still be wrong. Before presenting a trend, confirm that campaign parameters are present, conversion events fire once, internal clicks are excluded where possible, time zones match, and the report uses the intended attribution window. Check for duplicate contacts, test sends, bot activity, tracking-disabled links, delayed CRM updates, and changes in the platform’s metric definitions.
Reconcile totals across systems. Delivered messages in the email platform will not equal web sessions because not every recipient clicks, privacy tools intervene, and one click can create multiple sessions. However, campaign IDs and conversion counts should follow a plausible path. Investigate large unexplained gaps instead of forcing the numbers to match.
Example interpretation
Imagine delivery stays at 98%, unique click rate rises from 2.5% to 3.2%, and post-click conversion falls from 8% to 4%. The email attracted more traffic, but the extra clicks were less qualified or the landing experience weakened. Review segment mix, CTA promise, page changes, price, and tracking before declaring the new creative a winner. If revenue per delivered email also fell, the business result should outweigh the click lift.
Write a decision, not just a summary
End each report with the conclusion, supporting evidence, confidence, owner, and next action. A clear note might say: Keep the new CTA for active customers, restore the previous offer for older leads, verify mobile checkout, and rerun the segment test next week. This turns measurement into an operating process.
Create a Useful Reporting Cadence
After each campaign
Confirm delivery, links, tracking, and obvious anomalies. Record the campaign objective, audience, send time, creative version, and preliminary outcome. Avoid making major judgments before delayed conversions have had time to arrive.
Weekly
Review recent sends, automations, domain-level delivery, complaints, and broken journeys. Identify one or two actions for the next cycle. A short, decision-focused review is better than a large dashboard nobody uses.
Monthly or quarterly
Assess trends by lifecycle stage and campaign type. Review revenue, pipeline, retention, list growth, fatigue, experiment results, and data quality. Revisit attribution assumptions and remove metrics that no longer support decisions.
Use Mailtrackio for Timely Follow-Up Signals
Mailtrackio provides Gmail open tracking, live alerts, and a dashboard for teams that need to follow up at the right moment. This is especially helpful for proposals, recruiting, sales outreach, invoices, and other high-value one-to-one or small-batch communication. Pair open signals with replies, clicks, CRM stage changes, and real outcomes. A tracked open can suggest timing; it should not be treated as proof of intent.
Frequently Asked Questions
Which email marketing metric matters most?
The metric closest to the campaign’s business goal matters most. For a sales campaign that may be qualified pipeline or revenue; for onboarding it may be activation. Delivery, clicks, unsubscribes, and complaints explain why the primary outcome moved.
How often should performance be reviewed?
Check operational problems after every send, make tactical decisions weekly, and evaluate strategy monthly or quarterly. Match the conversion window to the buying cycle before finalizing conclusions.
Are open rates still useful?
Yes, as a directional diagnostic within comparable campaigns. Privacy protection, image blocking, prefetching, and bots make opens less reliable as a standalone success metric.
How do I track revenue from email?
Use consistent campaign parameters, preserve campaign IDs through the checkout or CRM journey, connect orders or opportunities to those IDs, and document the attribution model and window used in the report.
Put the Insights Into Action
Use Mailtrackio to add Gmail open tracking, live alerts, and practical follow-up visibility to the messages where timing matters. Visit Mailtrackio and combine engagement signals with replies, clicks, conversions, and respectful communication.



Comments
0 responsesNo comments yet. Be the first to share your thoughts.